Simple Analytics

About Simple Analytics
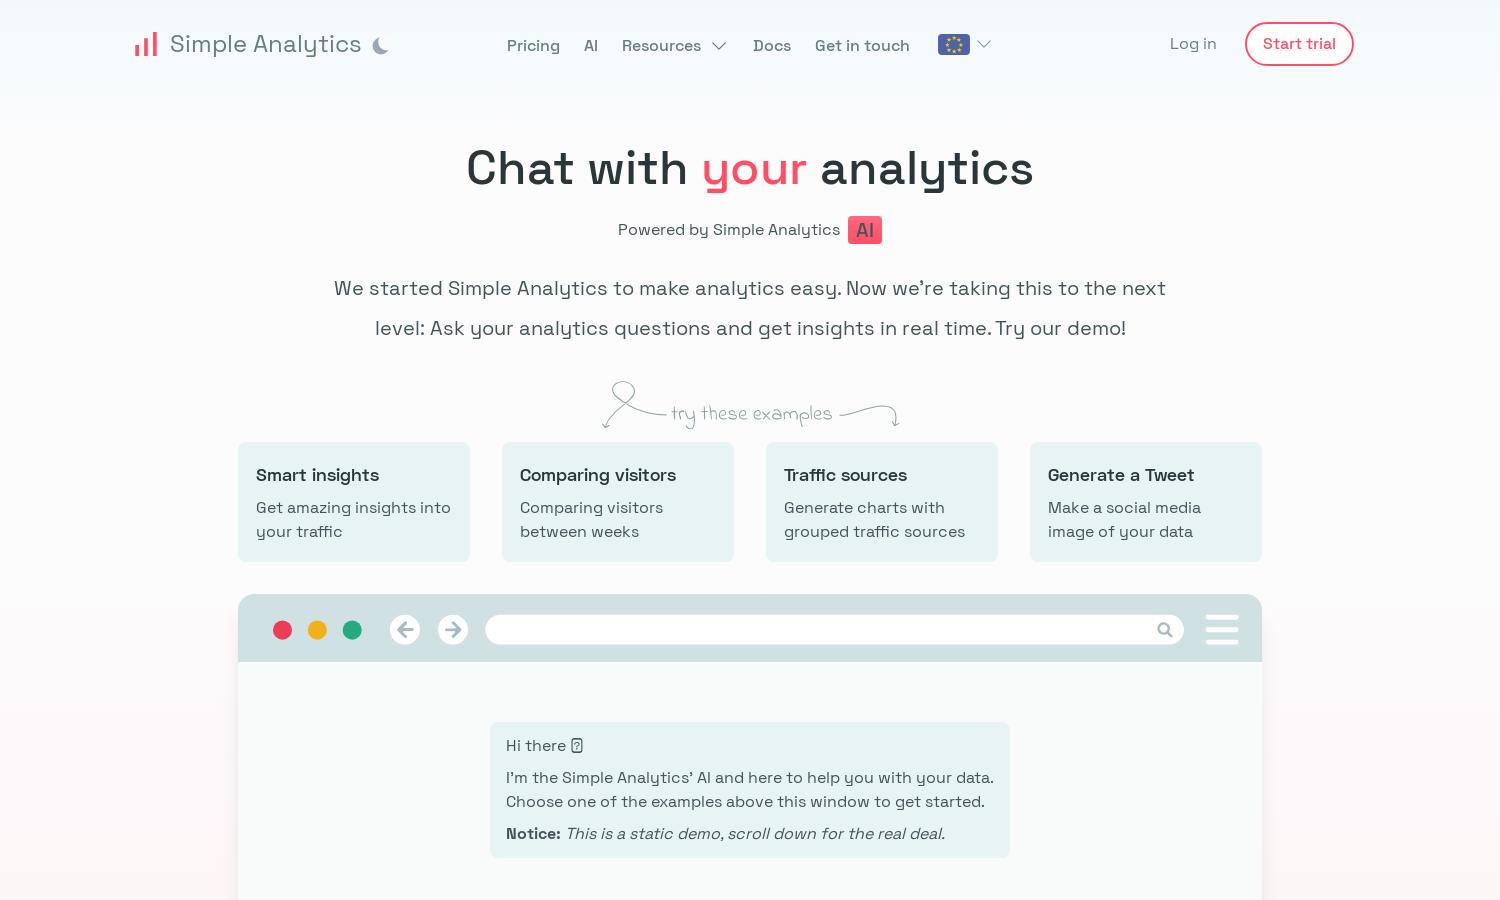
Simple Analytics is designed for businesses seeking to elevate their data analysis experience. By using AI-driven interactions, it allows users to ask questions and receive real-time insights from their analytics data, making data interpretation intuitive and accessible to all users.
Simple Analytics offers a free 14-day trial without a credit card requirement. Explore pricing plans including flexible subscription tiers that provide advanced features. Upgrading unlocks deeper analytics insights and enhanced visualizations, offering added value for users seeking comprehensive analytics capabilities.
The user interface of Simple Analytics is crafted to ensure a seamless browsing experience. With an intuitive layout, it allows users to navigate easily between insights, queries, and data visualization tools, enhancing user engagement and making analytics approachable and user-friendly.
How Simple Analytics works
Users interact with Simple Analytics by signing up for the platform, allowing them to access their analytics data. Once logged in, they can chat with the AI to pose questions about their data, receive immediate insights, and create visual representations like charts, all designed to simplify data interpretation.
Key Features for Simple Analytics
AI-driven data interaction
Simple Analytics' standout feature is its AI-driven data interaction, enabling users to converse with their analytics for real-time insights. This innovative approach removes barriers in data analysis, allowing users to pose questions and extract valuable information easily, enhancing decision-making processes.
Real-time insights generation
Another key feature of Simple Analytics is its ability to generate real-time insights from user queries. This functionality empowers users to make informed decisions based on current data, significantly improving response times and strategies with up-to-date analytics at their fingertips.
Customizable data visualization
Customizable data visualization is a unique offering of Simple Analytics that enhances user experience. Users can create beautiful, shareable charts that represent their data succinctly, allowing for effective communication of insights and trends, tailored to their specific analytical needs.


