ROIpad market research vs StatPecker
Side-by-side comparison to help you choose the right product.
ROIpad market research
ROIpad market research delivers data-driven insights to refine your B2B SaaS positioning, ensuring effective messaging and market alignment.
Last updated: April 13, 2026

StatPecker
StatPecker transforms your data into quick insights and stunning visuals, making analysis and sharing effortless.
Last updated: March 1, 2026
Visual Comparison
ROIpad market research
StatPecker
Feature Comparison
ROIpad market research
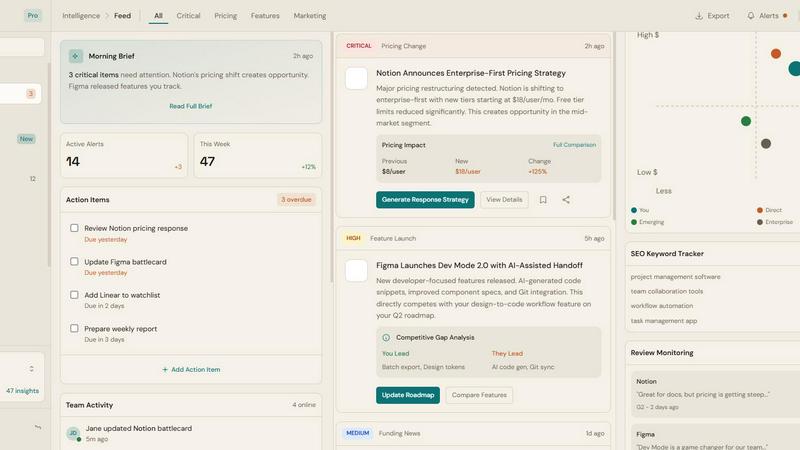
Continuous Competitive Positioning Analysis
This feature allows users to continually monitor and analyze their competitors' positioning strategies. By understanding the shifts in messaging and targeting, startups can adapt their approach in real-time, staying ahead of the competition and ensuring relevance in the market.
Positioning Comparison Matrix
The Positioning Comparison Matrix visually highlights the gaps and opportunities in the market by comparing your positioning against competitors. This tool enables users to identify white space and underserved segments, optimizing their messaging for maximum impact and engagement.
Messaging Gap Analysis
This feature identifies the critical angles that competitors have missed, providing insights into potential messaging opportunities. By focusing on underserved market segments, startups can fine-tune their communication strategies to attract high-intent buyers and reduce churn rates.
Niche Attractiveness Signals
ROIpad’s Niche Attractiveness Signals correlate market strategies with real revenue benchmarks. This feature helps startups identify which niches demonstrate the strongest revenue potential, allowing them to prioritize their efforts and resources effectively.
StatPecker
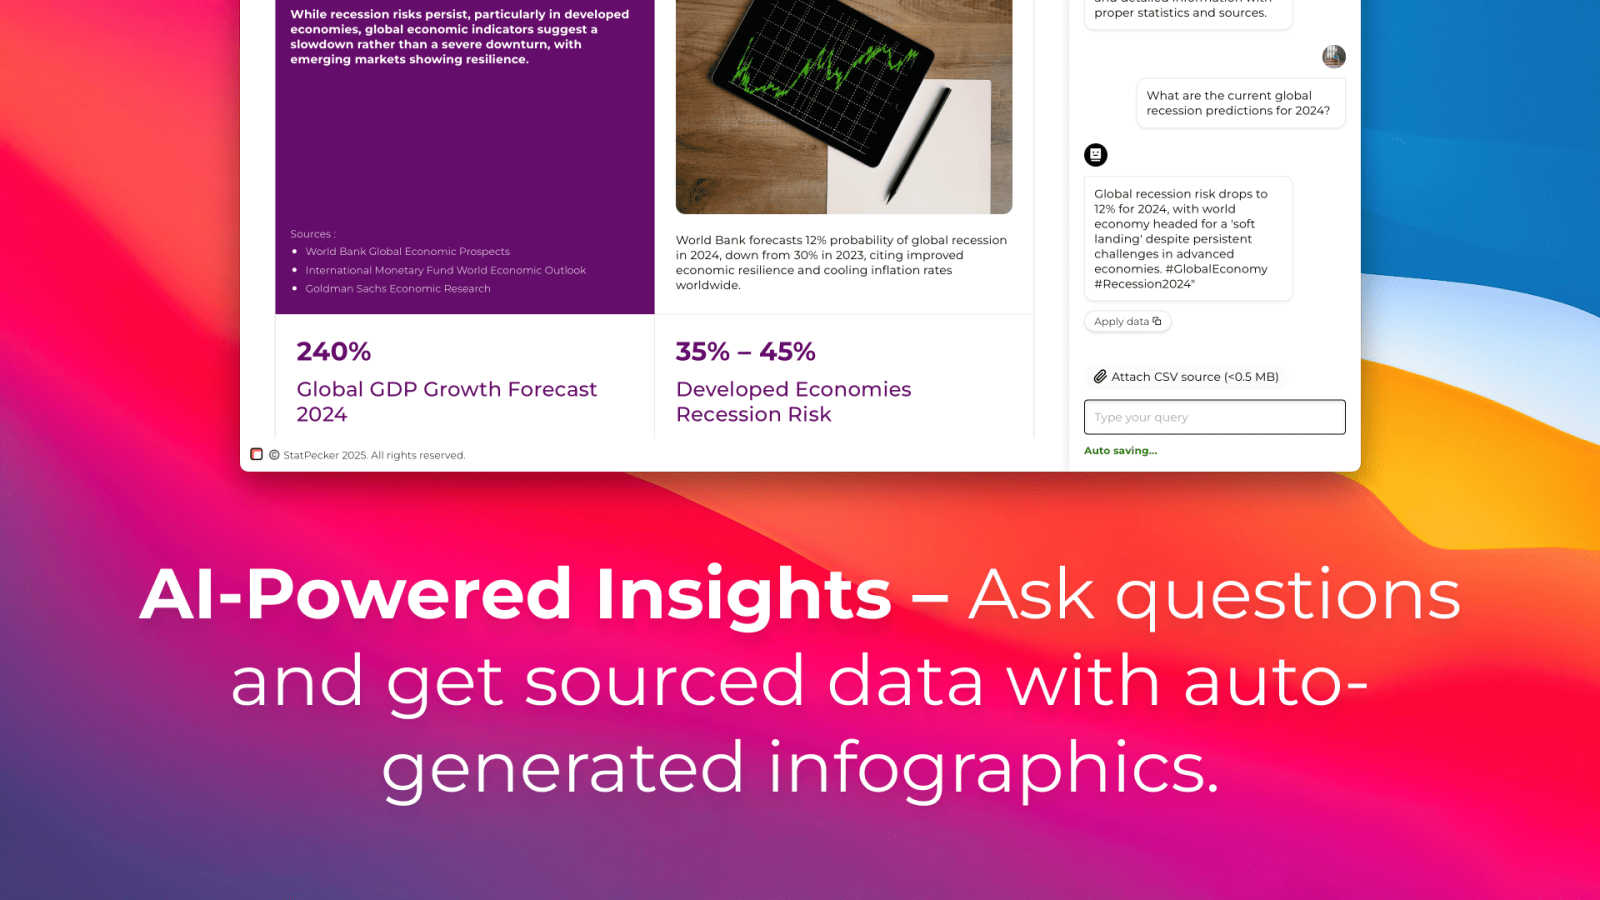
Ask Your Query
StatPecker simplifies data exploration by allowing users to ask direct questions and receive instant insights from validated sources. This feature eliminates the need for complex tools, making data analysis straightforward and efficient.
Publish & Embed
Create interactive visuals that can be easily integrated into blogs, articles, and websites. This feature ensures that users can not only generate stunning graphics but also share them seamlessly across various platforms.
Upload & Analyze CSVs
Users can upload local CSV files (up to 50 MB) and conduct insightful analyses without the hassle of traditional spreadsheets. The on-device analysis ensures that data remains private and secure while extracting key insights.
Download & Use Anywhere
StatPecker allows users to export infographics as images for use in reports, presentations, and more. This flexibility means that data storytelling can be enhanced across multiple formats, making it easier to share insights with any audience.
Use Cases
ROIpad market research
Enhancing Go-To-Market Strategies
Startups can leverage ROIpad to refine their go-to-market strategies by understanding the competitive landscape and aligning their messaging with market demands. This ensures that marketing efforts are directed towards the most promising segments.
Reducing Customer Acquisition Costs
By utilizing the insights from ROIpad, companies can attract high-intent users and significantly reduce customer acquisition costs. This leads to more effective marketing campaigns and improved overall profitability.
Improving Product Positioning
Founders can use ROIpad to gain clarity on their product positioning, addressing any misalignments with market needs. This allows for better-targeted messaging that resonates with the right audience.
Predicting Churn and Retention
With tools to analyze market signals and competitor positioning, startups can predict potential churn and implement retention strategies proactively. This minimizes the risk of losing valuable customers and stabilizes revenue streams.
StatPecker
For Content Creators
Content creators can utilize StatPecker to generate compelling infographics that enhance their storytelling. Whether for blogs, social media posts, or articles, the tool helps in presenting data in a visually engaging manner, capturing audience attention effectively.
For Data Analysts
Data analysts can leverage StatPecker to quickly visualize complex datasets and extract meaningful trends. This feature allows them to focus on interpretation rather than formatting, enhancing their productivity and the clarity of their presentations.
For Marketers
Marketers can use StatPecker to create visuals that illustrate campaign performance, market research, and customer insights. These infographics can be shared with teams or clients to support data-driven decisions and strategies.
For Educators
Educators can harness StatPecker to present educational data in a more engaging way, making lessons more interactive and insightful for students. This feature can simplify complex concepts, helping students grasp information more effectively.
Overview
About ROIpad market research
ROIpad market research is a cutting-edge competitive positioning and market intelligence platform designed specifically for startups looking to refine their market approach. It tackles the fundamental issue of poor positioning that leads to high customer acquisition costs, low conversion rates, and increased churn. Instead of relying on guesswork or generic AI suggestions, ROIpad provides a data-driven analysis of your current digital presence, competitor strategies, and market signals. This enables startups to identify the most lucrative niches and messaging angles that resonate with their target audience. By transforming positioning into a precise science, ROIpad empowers startups to make informed decisions, streamline their go-to-market strategies, and ultimately achieve a robust product-market fit, ensuring long-term growth and sustainability.
About StatPecker
StatPecker is an innovative, AI-driven tool designed to transform the way users engage with data by turning raw datasets into visually striking infographics in just seconds. This comprehensive solution eliminates the tedious process of manual reporting and the high costs typically associated with hiring professional designers. Ideal for a variety of users—including content creators, analysts, marketers, and educators—StatPecker empowers individuals to enhance storytelling through powerful visuals. With seamless data visualization automation, users can concentrate on deriving insights rather than getting bogged down with formatting details. Its advanced features allow for easy data uploads, insightful analyses, and the creation of interactive visual presentations, ensuring that data is not only visually appealing but also impactful and accessible for everyone.
Frequently Asked Questions
ROIpad market research FAQ
How does ROIpad help with positioning?
ROIpad provides a data-driven analysis of your current positioning, competitor strategies, and market signals. This enables startups to make informed decisions rather than relying on guesswork.
What types of reports can I expect from ROIpad?
Users receive a Positioning Comparison Matrix, Messaging Gap Analysis, and Niche Attractiveness Signals report, all of which are designed to provide actionable insights for optimizing market strategies.
Is ROIpad suitable for early-stage startups?
Absolutely! ROIpad is designed with early-stage startups in mind, helping them navigate the complexities of market positioning and ensuring they are targeting the right audience effectively.
How often should I use ROIpad?
ROIpad is a continuous platform, and regular usage is encouraged to stay updated with market shifts and competitor strategies. Frequent analysis can significantly enhance your positioning strategy over time.
StatPecker FAQ
How does StatPecker ensure data security?
StatPecker employs on-device analysis for uploaded data, meaning that your information remains private and secure throughout the analysis process. No data is sent to external servers, ensuring confidentiality.
Can I use StatPecker for free?
Yes, StatPecker offers a free tier that includes unlimited projects, embeds with manual edits, and a limited number of AI queries and CSV uploads. This allows users to explore the tool’s capabilities without any cost.
What types of files can I upload to StatPecker?
Users can upload CSV files of up to 50 MB to analyze and visualize their data. This format is widely used and allows for straightforward data handling, making it easy for users to get started.
Is there a refund policy for paid users?
Yes, StatPecker offers a 10-day refund policy for paid users, ensuring satisfaction without any questions asked. This policy allows users to try the full range of features risk-free.
Alternatives
ROIpad market research Alternatives
ROIpad market research is a cutting-edge platform designed to provide B2B SaaS companies with data-backed competitive intelligence and market signals. By transforming positioning from an uncertain guessing game into a precise science, ROIpad helps startups align their messaging with market demands to reduce acquisition costs and improve conversion rates. Users often seek alternatives to ROIpad market research for various reasons, including pricing concerns, specific feature requirements, or preferences for certain platforms. When choosing an alternative, it's crucial to look for solutions that offer robust data analysis, intuitive interfaces, and actionable insights that align with your unique business needs.
StatPecker Alternatives
StatPecker is an innovative, AI-powered data visualization tool designed to transform how users interact with their data. It specializes in converting raw datasets into stunning infographics quickly, making it a vital resource for content creators, analysts, marketers, and educators who want to enhance storytelling through visuals. However, users often seek alternatives due to factors such as pricing, specific feature sets, or compatibility with their preferred platforms. When considering alternatives to StatPecker, it's essential to evaluate the ease of use, the range of visualization options, integration capabilities, and overall cost-effectiveness. Assessing how well an alternative aligns with your specific needs and workflows can lead to a more efficient and impactful data visualization experience.