Fusedash vs StatPecker
Side-by-side comparison to help you choose the right product.
Fusedash transforms raw data into interactive dashboards and charts, empowering teams to act on insights instantly.
Last updated: March 4, 2026

StatPecker
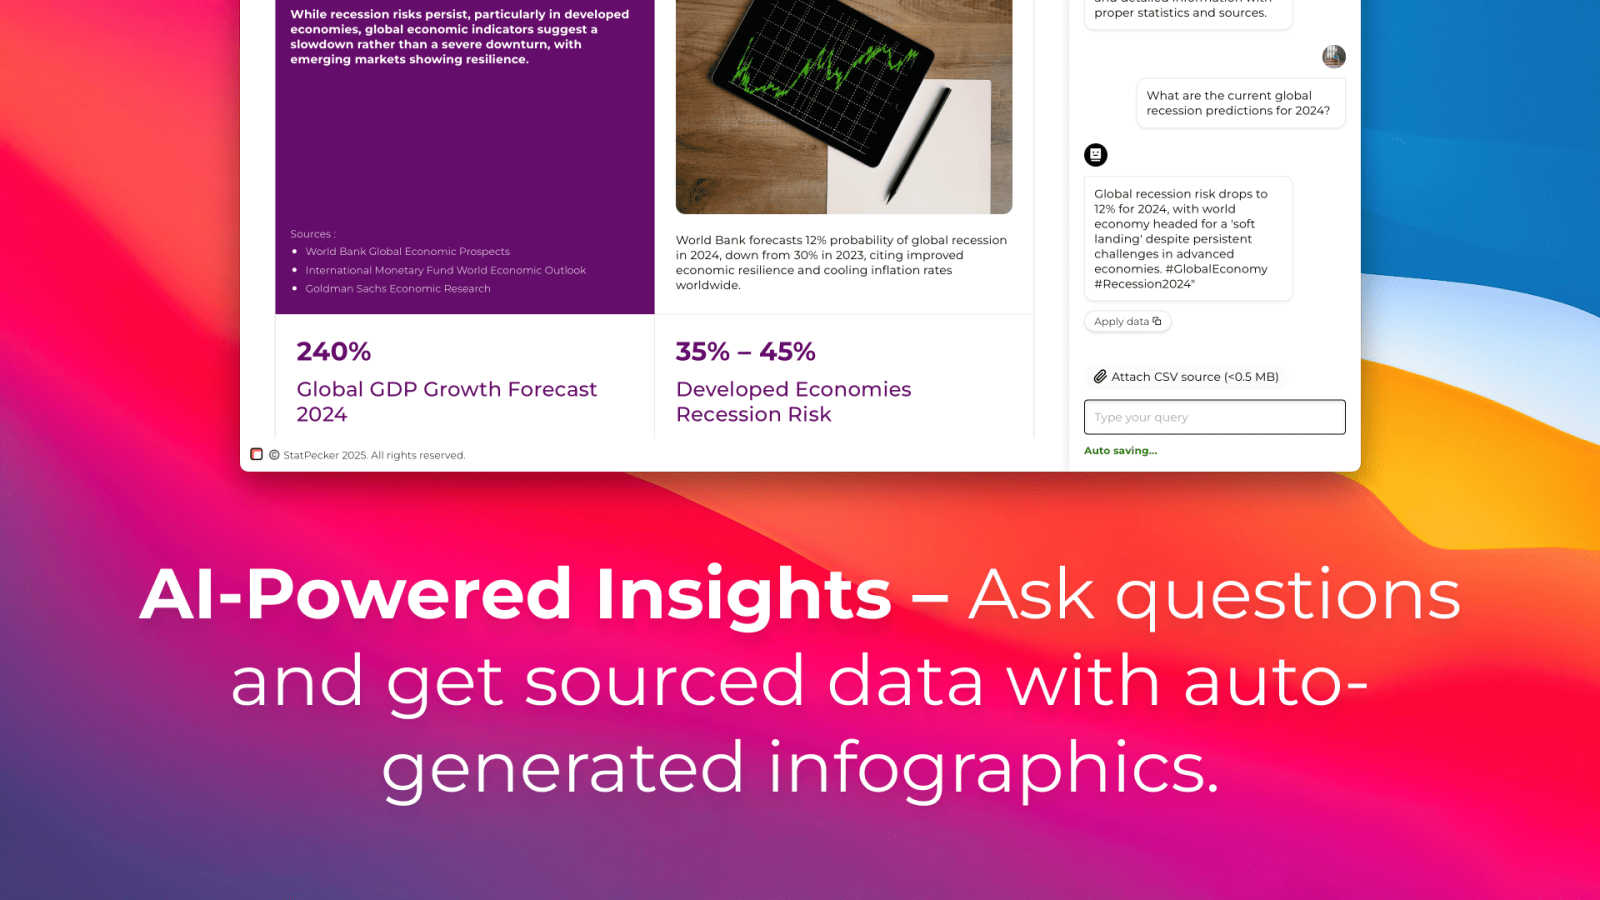
StatPecker transforms your data into quick insights and stunning visuals, making analysis and sharing effortless.
Last updated: March 1, 2026
Visual Comparison
Fusedash

StatPecker
Feature Comparison
Fusedash
Flexible Views
Fusedash allows users to create tailored visualizations for different audiences, transforming the same dataset into dashboards, charts, maps, or report-style views. This means stakeholders can access precisely the information they need without unnecessary back-and-forth communication, enhancing productivity and clarity throughout the organization.
AI Chart Generator
With the AI Chart Generator, users can create visually appealing charts from CSVs or APIs in a matter of minutes. This feature not only helps in selecting the most appropriate chart type but also allows for easy comparisons and refined labeling, ensuring that each chart effectively conveys the intended narrative. Users can drop these charts into dashboards or utilize them as standalone visuals for reports.
Dashboard Software
Fusedash combines the power of dashboards with narrative reporting in a single workspace. This integration ensures that stakeholders not only monitor KPIs but also receive contextual insights into what the data means, why it matters, and the implications for future actions. This approach helps maintain team alignment and minimizes the chances of conflicting interpretations of the same report.
AI Chat
The Smart Chat feature allows users to ask questions in plain language about their data, making it easier to explore insights and gather suggestions for the best metrics or visualizations. This conversational interface accelerates the data exploration process and enables users to turn insights into shareable dashboard views instantly, enhancing collaboration and decision-making.
StatPecker
Ask Your Query
StatPecker simplifies data exploration by allowing users to ask direct questions and receive instant insights from validated sources. This feature eliminates the need for complex tools, making data analysis straightforward and efficient.
Publish & Embed
Create interactive visuals that can be easily integrated into blogs, articles, and websites. This feature ensures that users can not only generate stunning graphics but also share them seamlessly across various platforms.
Upload & Analyze CSVs
Users can upload local CSV files (up to 50 MB) and conduct insightful analyses without the hassle of traditional spreadsheets. The on-device analysis ensures that data remains private and secure while extracting key insights.
Download & Use Anywhere
StatPecker allows users to export infographics as images for use in reports, presentations, and more. This flexibility means that data storytelling can be enhanced across multiple formats, making it easier to share insights with any audience.
Use Cases
Fusedash
Business Performance Monitoring
Fusedash is ideal for organizations that need to track business performance metrics in real-time. By utilizing its dashboards and visualizations, teams can quickly identify trends, make informed decisions, and adjust strategies based on accurate, up-to-date data.
Marketing Campaign Analysis
Marketing teams can leverage Fusedash to assess the effectiveness of campaigns across multiple channels. By visualizing campaign performance data, they can pinpoint successful strategies and areas for improvement, leading to more effective future marketing efforts.
Financial Reporting
Finance departments can utilize Fusedash for generating comprehensive financial reports that combine KPIs, narratives, and visualizations. This helps in providing stakeholders with a clear understanding of financial health, trends, and forecasts, ensuring informed decision-making.
Operations Optimization
Operations teams can use Fusedash to monitor key operational metrics, analyze process efficiencies, and identify bottlenecks. By visualizing data related to supply chain performance or service delivery, teams can optimize their workflows and enhance overall productivity.
StatPecker
For Content Creators
Content creators can utilize StatPecker to generate compelling infographics that enhance their storytelling. Whether for blogs, social media posts, or articles, the tool helps in presenting data in a visually engaging manner, capturing audience attention effectively.
For Data Analysts
Data analysts can leverage StatPecker to quickly visualize complex datasets and extract meaningful trends. This feature allows them to focus on interpretation rather than formatting, enhancing their productivity and the clarity of their presentations.
For Marketers
Marketers can use StatPecker to create visuals that illustrate campaign performance, market research, and customer insights. These infographics can be shared with teams or clients to support data-driven decisions and strategies.
For Educators
Educators can harness StatPecker to present educational data in a more engaging way, making lessons more interactive and insightful for students. This feature can simplify complex concepts, helping students grasp information more effectively.
Overview
About Fusedash
Fusedash is an innovative AI-powered data visualization platform that revolutionizes how teams access and interpret their connected data. Designed for organizations seeking clarity and efficiency, Fusedash enables users to create decision-ready dashboards, interactive charts, detailed maps, and narrative reports—all within a single, unified workspace. By eliminating the need to replicate logic across disconnected tools, Fusedash offers a streamlined approach to data analysis. The platform's core value proposition lies in its ability to ensure consistency: once key metrics and KPIs are defined, they can be reused across various views and reports, fostering alignment across departments from leadership to marketing to operations. Fusedash is perfect for teams frustrated with manual reporting cycles and conflicting data narratives. It empowers users to not only monitor real-time data effectively but also dive deeper into understanding the underlying reasons behind trends and changes. With integrated AI features like natural language data chat and intelligent visualization assistance, Fusedash makes data exploration intuitive and fast, transforming raw data into a reliable source of truth that drives actionable insights and strategic decisions.
About StatPecker
StatPecker is an innovative, AI-driven tool designed to transform the way users engage with data by turning raw datasets into visually striking infographics in just seconds. This comprehensive solution eliminates the tedious process of manual reporting and the high costs typically associated with hiring professional designers. Ideal for a variety of users—including content creators, analysts, marketers, and educators—StatPecker empowers individuals to enhance storytelling through powerful visuals. With seamless data visualization automation, users can concentrate on deriving insights rather than getting bogged down with formatting details. Its advanced features allow for easy data uploads, insightful analyses, and the creation of interactive visual presentations, ensuring that data is not only visually appealing but also impactful and accessible for everyone.
Frequently Asked Questions
Fusedash FAQ
What types of data can I connect to Fusedash?
Fusedash supports a variety of data sources, including CSV uploads, API connections, and public data integration. This flexibility allows users to combine multiple datasets for comprehensive analysis and visualization.
How does Fusedash ensure data consistency across reports?
Fusedash promotes data consistency by allowing users to define key metrics and KPIs once, which can then be reused across all dashboards, charts, and reports. This ensures that all teams are referencing the same data, reducing discrepancies.
Can I customize my dashboards and reports in Fusedash?
Absolutely! Fusedash provides extensive customization options for dashboards and reports, enabling users to adjust layouts, filters, time ranges, and visual elements to meet the specific needs of different audiences.
Is there a demo available for Fusedash?
Yes, Fusedash offers a demo for potential users to explore its features and capabilities. Interested individuals can request a demo through the Fusedash website to see how the platform can benefit their organization.
StatPecker FAQ
How does StatPecker ensure data security?
StatPecker employs on-device analysis for uploaded data, meaning that your information remains private and secure throughout the analysis process. No data is sent to external servers, ensuring confidentiality.
Can I use StatPecker for free?
Yes, StatPecker offers a free tier that includes unlimited projects, embeds with manual edits, and a limited number of AI queries and CSV uploads. This allows users to explore the tool’s capabilities without any cost.
What types of files can I upload to StatPecker?
Users can upload CSV files of up to 50 MB to analyze and visualize their data. This format is widely used and allows for straightforward data handling, making it easy for users to get started.
Is there a refund policy for paid users?
Yes, StatPecker offers a 10-day refund policy for paid users, ensuring satisfaction without any questions asked. This policy allows users to try the full range of features risk-free.
Alternatives
Fusedash Alternatives
Fusedash is an AI-powered data visualization platform that belongs to the Analytics & Data and Business Intelligence categories. It enables teams to transform their raw data into clear, actionable insights through decision-ready dashboards, interactive charts, and narrative reports. Its core value lies in providing a unified workspace that promotes consistency and efficiency, ensuring every team member operates from the same trusted data. Users often seek alternatives to Fusedash due to various factors, including pricing, specific features, or the need for compatibility with existing systems. When choosing an alternative, look for solutions that prioritize user experience, offer robust data integration capabilities, and ensure real-time access to insights. A focus on collaboration and shared metrics is also essential for maintaining alignment across teams.
StatPecker Alternatives
StatPecker is an innovative, AI-powered data visualization tool designed to transform how users interact with their data. It specializes in converting raw datasets into stunning infographics quickly, making it a vital resource for content creators, analysts, marketers, and educators who want to enhance storytelling through visuals. However, users often seek alternatives due to factors such as pricing, specific feature sets, or compatibility with their preferred platforms. When considering alternatives to StatPecker, it's essential to evaluate the ease of use, the range of visualization options, integration capabilities, and overall cost-effectiveness. Assessing how well an alternative aligns with your specific needs and workflows can lead to a more efficient and impactful data visualization experience.